Lab: Acceleration Down a 'Frictionless' Inclined Plane
EQUIPMENT NEEDED
• Science Workshop™ Interface
• dynamics cart
• picket fence
• photogate
PURPOSE
The purpose of this laboratory activity is to measure the component of acceleration due to gravity by measuring the change in velocity of a dynamics cart through a photogate.
THEORY
If a cart moves on a plane that is inclined at an angle θ, the component of force acting on the cart in a direction that is parallel to the surface of the plane is mg sin θ, where m is the mass of the cart, and g is the acceleration due to gravity.
The acceleration of the cart should be g sin θ down the inclined plane.
Equation 1: a = g sin θ
PROCEDURE
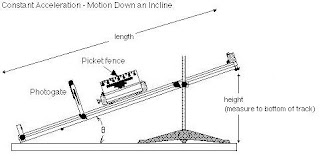
In this activity, you will release a dynamics cart with a “picket fence” (a clear plastic strip with uniformly spaced opaque bands) on top and allow it to pass through a photogate. The photogate beam is blocked by each opaque band and the time from one blockage to the next becomes increasingly shorter. Knowing the distance between the leading edge of each opaque band, the Science Workshop program calculates the velocity and acceleration of the cart.
[Insert the experimental setup here...see above.]
PART I: Computer Setup
1. Connect the Science Workshop interface to the computer, turn on the interface and then turn on the computer.
2. Connect the photogate to Digital Channel 1 on the interface.
3. Open the Science Workshop file P06_FALL.SWS found in this folder: c:\sciwkshp\library\physics.
The document will open with a Graph display and a Table of Position, Velocity, and Acceleration versus Time. You may close the graph display.
4. Double-click the photogate icon and set the opaque band spacing to .020 m.
PART II: Data Recording
1. Measure the height and length of the track. The ratio of the height to length is the sin θ.
NOTE: The height should be measured from the table to the bottom edge of the track.
2. Place the cart at the starting point on the track.
3. Click the “REC” button in the Experiment Setup window.
4. After the cart passes through the beam, click “STOP” to end recording.
5. Click the “Statistics” button Σ in the Table display. Record the mean value for acceleration in the a (exp) row of the data table.
6. Repeat this procedure three times for each height to obtain an average value for acceleration.
7. Conduce trials for five different heights of the track ranging from 15 cm to 30 cm.
Things to Consider...
● What would you expect to observe for the velocity of the cart as it passes through the photogate?
● What would you expect to observe for the acceleration of the cart as it passes through the photogate?
● Do you need to start the cart from same position each time?
● Is it better to position photogate closer to cart's starting position or further away?
DATA TABLE
[Insert your data here.]
ANALYSIS/QUESTIONS
1. Produce a graph of the experimental acceleration vs. sin θ. Plot the acceleration on the y-axis and the sin θ on the x-axis. Using the line of best fit, determine the acceleration due to gravity.
2. Identify two key factors that may responsible for the experimental and theoretical values to be different and explain how those factors would have affected your results. Be specific - do not state it was 'human error'.
3. In your conclusion, be sure to summarize your purpose and theory and discuss whether or not this experiment was successful in verifying the theory.


